The peace of green
No, we are not going to talk about the environment (i.e., the set of variables as printed by /usr/bin/env. What else? :-)).
After months in which we had a couple of tests failing every day, we finally managed to turn (almost) everything green today, at least on Linux. Enjoy this screenshoot taken from the nightly build page:

As usual, the full buildbot results can be seen from the summary page.
cheers, Anto
PhD Thesis about PyPy's CLI JIT Backend
Hi all,
few months ago I finished the PhD studies and now my thesis is available, just in case someone does not have anything better to do than read it :-).
The title of the thesis is High performance implementation of Python for CLI/.NET with JIT compiler generation for dynamic languages, and its mainly based on my work on the CLI backend for the PyPy JIT (note that the CLI JIT backend is currently broken on trunk, but it's still working in the cli-jit branch).
The thesis might be useful also for people that are not directly interested in the CLI JIT backend, as it also contains general information about the inner workings of PyPy which are independent from the backend: in particular, chapters 5 and 6 explain how the JIT frontend works.
- Here is the summary of chapters:
- Introduction
- The problem
- Enter PyPy
- Characterization of the target platform
- Tracing JITs in a nutshell
- The PyPy JIT compiler generator
- The CLI JIT backend
- Benchmarks
- Conclusion and Future Work
cheers, Anto
Very interesting stuff, still busily reading... could you write a short bibtex entry for citation? Thanks
thank you, guys :-)
@anonymous: here you can find the bibtex for the thesis, as wall as for other PyPy related papers: https://codespeak.net/svn/pypy/extradoc/talk/bibtex.bib
@glyph: unfortunately, trunk has diverged a lot since the cli-jit branch, and merging is not an easy issue. There are also fundamental features that on CLI cannot be implemented as efficently as on x86. It's on my todo list, but no concrete plan so far :-(
Next PyPy sprint
Hi all,
The next PyPy sprint is scheduled for the end of the month, from the 25th to the 31st of October 2010. It will be done at the university of Düsseldorf, Germany, where three of us are working.
Please see this link for more information.
PyPy in Google's Summer of Code 2010
Hello.
This year we had a record of two and a half applications (one was on a cross section of PyPy and numpy) accepted for the Google SoC program. Since it ended a couple of weeks ago, we wanted to present the results that were achieved. All three projects were completed successfully, although the rate of success varied quite a bit.
The Numpy proposal progress significantly on making numpy compatible with PyPy's CPython's extension module support, but failed to bring PyPy's numpy implementation into a usable shape (which is a somewhat ambitious goal, one might argue). The experiments done during the projects are living on the micronumpy branch.
The Fast ctypes proposal did some useful experiments on how to JIT external calls from PyPy to C, however, the actual code as of now is not very interesting and it's quite far from providing a full ctypes replacement (or equivalent).
Definitely the most successful proposal was a 64bit (x86_64) backend for PyPy's JIT. It not only includes working 64bit JIT (merged into PyPy trunk), but also a working asmgcc for x86_64 linux platform, that makes it possible to run the JIT on this architecture with our advanced garbage collectors. One can say that x64_64 is now no longer a second-class citizen for PyPy, although it definitely didn't receive as much testing as the x86 platform. Expect this to be a major selling point for the next PyPy release :-)
Cheers, fijal & the PyPy team
Using Escape Analysis Across Loop Boundaries for Specialization
This blog post is a successor to the one about escape analysis in PyPy's JIT. The examples from there will be continued here. This post is a bit science-fictiony. The algorithm that PyPy currently uses is significantly more complex and much harder than the one that is described here. The resulting behaviour is very similar, however, so we will use the simpler version (and we might switch to that at some point in the actual implementation).
In the last blog post we described how escape analysis can be used to remove many of the allocations of short-lived objects and many of the type dispatches that are present in a non-optimized trace. In this post we will improve the optimization to also handle more cases.
To understand some more what the optimization described in the last blog post can achieve, look at the following figure:
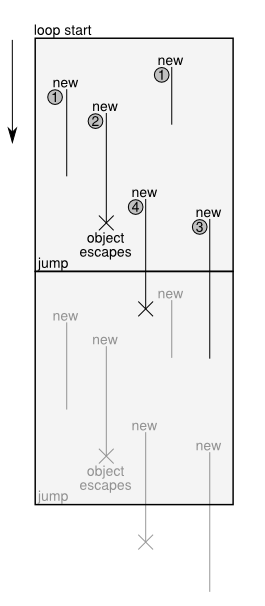
The figure shows a trace before optimization, together with the lifetime of various kinds of objects created in the trace. It is executed from top to bottom. At the bottom, a jump is used to execute the same loop another time. For clarity, the figure shows two iterations of the loop. The loop is executed until one of the guards in the trace fails, and the execution is aborted.
Some of the operations within this trace are new operations, which each create a new instance of some class. These instances are used for a while, e.g. by calling methods on them, reading and writing their fields. Some of these instances escape, which means that they are stored in some globally accessible place or are passed into a function.
Together with the new operations, the figure shows the lifetimes of the created objects. Objects in category 1 live for a while, and are then just not used any more. The creation of these objects is removed by the optimization described in the last blog post.
Objects in category 2 live for a while and then escape. The optimization of the last post deals with them too: the new that creates them and the field accesses are deferred, until the point where the object escapes.
The objects in category 3 and 4 are in principle like the objects in category 1 and 2. They are created, live for a while, but are then passed as an argument to the jump operation. In the next iteration they can either die (category 3) or escape (category 4).
The optimization of the last post considered the passing of an object along a jump to be equivalent to escaping. It was thus treating objects in category 3 and 4 like those in category 2.
The improved optimization described in this post will make it possible to deal better with objects in category 3 and 4. This will have two consequences: on the one hand, more allocations are removed from the trace (which is clearly good). As a side-effect of this, the traces will also be type-specialized.
Optimizing Across the Jump
Let's look at the final trace obtained in the last post for the example loop. The final trace was much better than the original one, because many allocations were removed from it. However, it also still contained allocations:
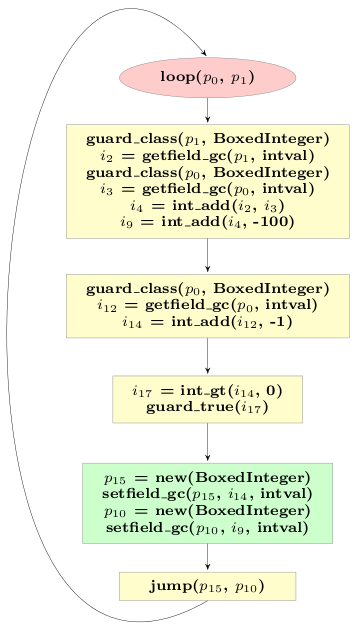
The two new BoxedIntegers stored in p15 and p10 are passed into the next iteration of the loop. The next iteration will check that they are indeed BoxedIntegers, read their intval fields and then not use them any more. Thus those instances are in category 3.
In its current state the loop allocates two BoxedIntegers at the end of every iteration, that then die very quickly in the next iteration. In addition, the type checks at the start of the loop are superfluous, at least after the first iteration.
The reason why we cannot optimize the remaining allocations away is because their lifetime crosses the jump. To improve the situation, a little trick is needed. The trace above represents a loop, i.e. the jump at the end jumps to the beginning. Where in the loop the jump occurs is arbitrary, since the loop can only be left via failing guards anyway. Therefore it does not change the semantics of the loop to put the jump at another point into the trace and we can move the jump operation just above the allocation of the objects that appear in the current jump. This needs some care, because the arguments to jump are all currently live variables, thus they need to be adapted.
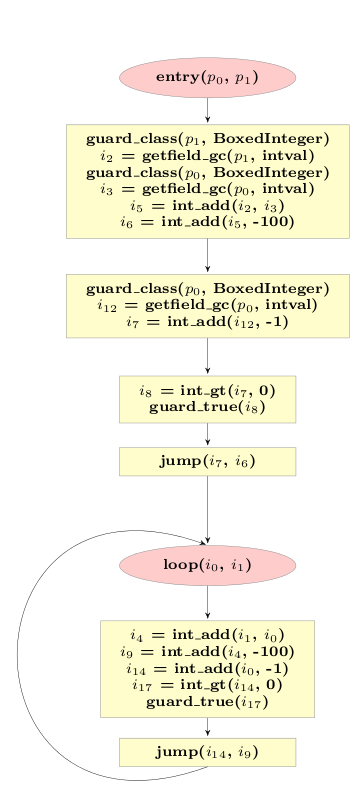
If we do that for our example trace above, the trace looks like this:
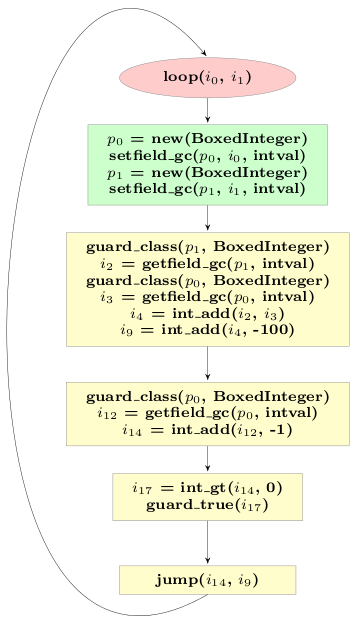
Now the lifetime of the remaining allocations no longer crosses the jump, and we can run our escape analysis a second time, to get the following trace:
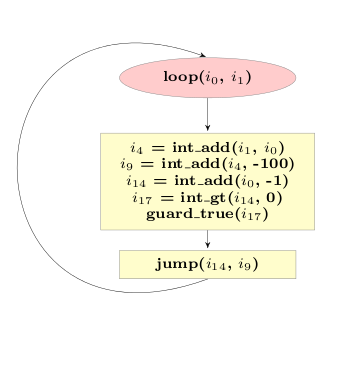
This result is now really good. The code performs the same operations than the original code, but using direct CPU arithmetic and no boxing, as opposed to the original version which used dynamic dispatching and boxing.
Looking at the final trace it is also completely clear that specialization has happened. The trace corresponds to the situation in which the trace was originally recorded, which happened to be a loop where BoxedIntegers were used. The now resulting loop does not refer to the BoxedInteger class at all any more, but it still has the same behaviour. If the original loop had used BoxedFloats, the final loop would use float_* operations everywhere instead (or even be very different, if the object model had user-defined classes).
Entering the Loop
The approach of placing the jump at some other point in the loop leads to one additional complication that we glossed over so far. The beginning of the original loop corresponds to a point in the original program, namely the while loop in the function f from the last post.
Now recall that in a VM that uses a tracing JIT, all programs start by being interpreted. This means that when f is executed by the interpreter, it is easy to go from the interpreter to the first version of the compiled loop. After the jump is moved and the escape analysis optimization is applied a second time, this is no longer easily possible. In particular, the new loop expects two integers as input arguments, while the old one expected two instances.
To make it possible to enter the loop directly from the intepreter, there needs to be some additional code that enters the loop by taking as input arguments what is available to the interpreter, i.e. two instances. This additional code corresponds to one iteration of the loop, which is thus peeled off:
Summary
The optimization described in this post can be used to optimize away allocations in category 3 and improve allocations in category 4, by deferring them until they are no longer avoidable. A side-effect of these optimizations is also that the optimized loops are specialized for the types of the variables that are used inside them.
Escape Analysis in PyPy's JIT
The goal of a just-in-time compiler for a dynamic language is obviously to improve the speed of the language over an implementation of the language that uses interpretation. The first goal of a JIT is thus to remove the interpretation overhead, i.e. the overhead of bytecode (or AST) dispatch and the overhead of the interpreter's data structures, such as operand stack etc. The second important problem that any JIT for a dynamic language needs to solve is how to deal with the overhead of boxing of primitive types and of type dispatching. Those are problems that are usually not present in statically typed languages.
Boxing of primitive types means that dynamic languages need to be able to handle all objects, even integers, floats, etc. in the same way as user-defined instances. Thus those primitive types are usually boxed, i.e. a small heap-structure is allocated for them, that contains the actual value.
Type dispatching is the process of finding the concrete implementation that is applicable to the objects at hand when doing a generic operation at hand. An example would be the addition of two objects: The addition needs to check what the concrete objects are that should be added are, and choose the implementation that is fitting for them.
Last year, we wrote a blog post and a paper about how PyPy's meta-JIT approach works. These explain how the meta-tracing JIT can remove the overhead of bytecode dispatch. In this post (and probably a followup) we want to explain how the traces that are produced by our meta-tracing JIT are then optimized to also remove some of the overhead more closely associated to dynamic languages, such as boxing overhead and type dispatching. The most important technique to achieve this is a form of escape analysis that we call virtual objects. This is best explained via an example.
Running Example
For the purpose of this blog post, we are going to use a very simple object model, that just supports an integer and a float type. The objects support only two operations, add, which adds two objects (promoting ints to floats in a mixed addition) and is_positive, which returns whether the number is greater than zero. The implementation of add uses classical Smalltalk-like double-dispatching. These classes could be part of the implementation of a very simple interpreter written in RPython.
class Base(object):
    def add(self, other):
        """ add self to other """
        raise NotImplementedError("abstract base")
    def add__int(self, intother):
        """ add intother to self, where intother is a Python integer """
        raise NotImplementedError("abstract base")
    def add__float(self, floatother):
        """ add floatother to self, where floatother is a Python float """
        raise NotImplementedError("abstract base")
    def is_positive(self):
        """ returns whether self is positive """
        raise NotImplementedError("abstract base")

class BoxedInteger(Base):
    def __init__(self, intval):
        self.intval = intval
    def add(self, other):
        return other.add__int(self.intval)
    def add__int(self, intother):
        return BoxedInteger(intother + self.intval)
    def add__float(self, floatother):
        return BoxedFloat(floatother + float(self.intval))
    def is_positive(self):
        return self.intval > 0

class BoxedFloat(Base):
    def __init__(self, floatval):
        self.floatval = floatval
    def add(self, other):
        return other.add__float(self.floatval)
    def add__int(self, intother):
        return BoxedFloat(float(intother) + self.floatval)
    def add__float(self, floatother):
        return BoxedFloat(floatother + self.floatval)
    def is_positive(self):
        return self.floatval > 0.0
Using these classes to implement arithmetic shows the basic problem that a dynamic language implementation has. All the numbers are instances of either BoxedInteger or BoxedFloat, thus they consume space on the heap. Performing many arithmetic operations produces lots of garbage quickly, thus putting pressure on the garbage collector. Using double dispatching to implement the numeric tower needs two method calls per arithmetic operation, which is costly due to the method dispatch.
To understand the problems more directly, let us consider a simple function that uses the object model:
def f(y):
    res = BoxedInteger(0)
    while y.is_positive():
        res = res.add(y).add(BoxedInteger(-100))
        y = y.add(BoxedInteger(-1))
    return res
The loop iterates y times, and computes something in the process. To understand the reason why executing this function is slow, here is the trace that is produced by the tracing JIT when executing the function with y being a BoxedInteger:
# arguments to the trace: p0, p1
# inside f: res.add(y)
guard_class(p1, BoxedInteger)
    # inside BoxedInteger.add
    i2 = getfield_gc(p1, intval)
    guard_class(p0, BoxedInteger)
        # inside BoxedInteger.add__int
        i3 = getfield_gc(p0, intval)
        i4 = int_add(i2, i3)
        p5 = new(BoxedInteger)
            # inside BoxedInteger.__init__
            setfield_gc(p5, i4, intval)
# inside f: BoxedInteger(-100)
p6 = new(BoxedInteger)
    # inside BoxedInteger.__init__
    setfield_gc(p6, -100, intval)

# inside f: .add(BoxedInteger(-100))
guard_class(p5, BoxedInteger)
    # inside BoxedInteger.add
    i7 = getfield_gc(p5, intval)
    guard_class(p6, BoxedInteger)
        # inside BoxedInteger.add__int
        i8 = getfield_gc(p6, intval)
        i9 = int_add(i7, i8)
        p10 = new(BoxedInteger)
            # inside BoxedInteger.__init__
            setfield_gc(p10, i9, intval)

# inside f: BoxedInteger(-1)
p11 = new(BoxedInteger)
    # inside BoxedInteger.__init__
    setfield_gc(p11, -1, intval)

# inside f: y.add(BoxedInteger(-1))
guard_class(p0, BoxedInteger)
    # inside BoxedInteger.add
    i12 = getfield_gc(p0, intval)
    guard_class(p11, BoxedInteger)
        # inside BoxedInteger.add__int
        i13 = getfield_gc(p11, intval)
        i14 = int_add(i12, i13)
        p15 = new(BoxedInteger)
            # inside BoxedInteger.__init__
            setfield_gc(p15, i14, intval)

# inside f: y.is_positive()
guard_class(p15, BoxedInteger)
    # inside BoxedInteger.is_positive
    i16 = getfield_gc(p15, intval)
    i17 = int_gt(i16, 0)
# inside f
guard_true(i17)
jump(p15, p10)
(indentation corresponds to the stack level of the traced functions).
The trace is inefficient for a couple of reasons. One problem is that it checks repeatedly and redundantly for the class of the objects around, using a guard_class instruction. In addition, some new BoxedInteger instances are constructed using the new operation, only to be used once and then forgotten a bit later. In the next section, we will see how this can be improved upon, using escape analysis.
Virtual Objects
The main insight to improve the code shown in the last section is that some of the objects created in the trace using a new operation don't survive very long and are collected by the garbage collector soon after their allocation. Moreover, they are used only inside the loop, thus we can easily prove that nobody else in the program stores a reference to them. The idea for improving the code is thus to analyze which objects never escape the loop and may thus not be allocated at all.
This process is called escape analysis. The escape analysis of our tracing JIT works by using virtual objects: The trace is walked from beginning to end and whenever a new operation is seen, the operation is removed and a virtual object is constructed. The virtual object summarizes the shape of the object that is allocated at this position in the original trace, and is used by the escape analysis to improve the trace. The shape describes where the values that would be stored in the fields of the allocated objects come from. Whenever the optimizer sees a setfield that writes into a virtual object, that shape summary is thus updated and the operation can be removed. When the optimizer encounters a getfield from a virtual, the result is read from the virtual object, and the operation is also removed.
In the example from last section, the following operations would produce two virtual objects, and be completely removed from the optimized trace:
p5 = new(BoxedInteger)
setfield_gc(p5, i4, intval)
p6 = new(BoxedInteger)
setfield_gc(p6, -100, intval)
The virtual object stored in p5 would know that it is an BoxedInteger, and that the intval field contains i4, the one stored in p6 would know that its intval field contains the constant -100.
The following operations, that use p5 and p6 could then be optimized using that knowledge:
guard_class(p5, BoxedInteger)
i7 = getfield_gc(p5, intval)
# inside BoxedInteger.add
guard_class(p6, BoxedInteger)
# inside BoxedInteger.add__int
i8 = getfield_gc(p6, intval)
i9 = int_add(i7, i8)
The guard_class operations can be removed, because the classes of p5 and p6 are known to be BoxedInteger. The getfield_gc operations can be removed and i7 and i8 are just replaced by i4 and -100. Thus the only remaining operation in the optimized trace would be:
i9 = int_add(i4, -100)
The rest of the trace is optimized similarly.
So far we have only described what happens when virtual objects are used in operations that read and write their fields. When the virtual object is used in any other operation, it cannot stay virtual. For example, when a virtual object is stored in a globally accessible place, the object needs to actually be allocated, as it will live longer than one iteration of the loop.
This is what happens at the end of the trace above, when the jump operation is hit. The arguments of the jump are at this point virtual objects. Before the jump is emitted, they are forced. This means that the optimizers produces code that allocates a new object of the right type and sets its fields to the field values that the virtual object has. This means that instead of the jump, the following operations are emitted:
p15 = new(BoxedInteger)
setfield_gc(p15, i14, intval)
p10 = new(BoxedInteger)
setfield_gc(p10, i9, intval)
jump(p15, p10)
Note how the operations for creating these two instances has been moved down the trace. It looks like for these operations we actually didn't win much, because the objects are still allocated at the end. However, the optimization was still worthwhile even in this case, because some operations that have been performed on the forced virtual objects have been removed (some getfield_gc operations and guard_class operations).
The final optimized trace of the example looks like this:
# arguments to the trace: p0, p1
guard_class(p1, BoxedInteger)
i2 = getfield_gc(p1, intval)
guard_class(p0, BoxedInteger)
i3 = getfield_gc(p0, intval)
i4 = int_add(i2, i3)
i9 = int_add(i4, -100)

guard_class(p0, BoxedInteger)
i12 = getfield_gc(p0, intval)
i14 = int_add(i12, -1)

i17 = int_gt(i14, 0)
guard_true(i17)
p15 = new(BoxedInteger)
setfield_gc(p15, i14, intval)
p10 = new(BoxedInteger)
setfield_gc(p10, i9, intval)
jump(p15, p10)
The optimized trace contains only two allocations, instead of the original five, and only three guard_class operations, from the original seven.
Summary
In this blog post we described how simple escape analysis within the scope of one loop works. This optimizations reduces the allocation of many intermediate data structures that become garbage quickly in an interpreter. It also removes a lot of the type dispatching overhead. In a later post, we will explain how this optimization can be improved further.
Beautiful post. I love it when people dare to broach more 'advanced' subjects in blog format.
EuroPython 2010 Videos available
Hi all,
the videos of the talks from EuroPython 2010 are now available on blip.tv: in particular, there are the three videos of the PyPy talk.
Part 1: What's news in PyPy 1.2 and 1.3 (by Antonio Cuni)
Part 2: Just in Time compilation (by Armin Rigo)
Part 3: cpyext (by Amaury Forgeot d'Arc)
Moreover, here is Mark Shannon's talk which compares HotPy, Unladen Swallow and PyPy:
Can you post the links to the blip.tv pages, so I can go there and download the videos?
The blip.tv viewer applet has no such link, and even digging the source isn't helpful (it seems that they use different identifiers for embed applets than for the same videos on their own website). Grrr!
Sure, here are the links:
Part 1: https://europythonvideos.blip.tv/file/3981017/
Part 2: https://europythonvideos.blip.tv/file/3981028/
Part 3: https://europythonvideos.blip.tv/file/4000720/
HotPy: https://europythonvideos.blip.tv/file/3980963/
@Anonymous
You can also click the title of the video in the Blip.tv embedded player.
Call for Benchmarks
As you know, a lot of PyPy's recent development effort has gone into speeding up execution of Python programs. However, an additional good property of PyPy's Python interpreter is that most objects are represented in a much more compact way than in CPython. We would like to investigate some more advanced techniques to reduce the memory usage of Python programs further.
To do this it is necessary to investigate the memory behaviour of real programs with large heaps. For speed measurements there are standard benchmarks, but for memory improvements there is nothing comparable, the memory behaviour of large programs is not that well understood. Therefore we are looking for programs that we can study and use as benchmarks.
Specifically we are looking for Python programs with the following properties:
- large heaps of about 10MB-1GB
- should have non-trivial runtime as well (in the range of a few seconds), to judge the speed impact of optimizations
- ideally pure-Python programs that don't use extension modules so that they run under both CPython and PyPy (this is optional, but makes my life much easier).
We are also rather interested in programs that do a lot of string/unicode processing.
We would be grateful for all ideas. Telling us about a program also has the advantage that we will work on optimizing PyPy for it :-).
I'm not think very much about it. But Zodb, durus or dobbin could be useful.
portage, the official Gentoo Linux package manager, does package dependency resolution and can take a few seconds for large updates. It parses package metadata from text files.
You could run a program that determinizes a large NFA. Given an existing Python program that can determinize an NFA, you could give it an expanded version of the NFA on page 15 here: https://www.springerlink.com/content/cq16j1uv511g793g/fulltext.pdf. Another way is to take some complex NFAs, concatenate them, and determinize.
Bazaar and mercurial take a lot of memory (time as well) when updating/merging etc. large repositories, especially if they contain large files.
Pylint (https://www.logilab.org/project/pylint) could be a nice target. Pure Python, the size of the heap and run time depend on what kind of code you throw at it.
You could try loading and manipulating a large graph with NetworkX. Pure Python, and the size and runtime could be tuned by varying the size of the graph and the algorithms that are run.
The CDPedia creates and manipulates its index with a pure-python inverted index implementation.
It could be extracted and made into a benchmark - there are other pure-python inverted indices around, those could also work.
They do tend to use lots and lots of memory, the CDPedia's implementation uses the builtin array module for byte sequence manipulation and bare strings as data store (it's highly optimized for lowering CPython's memory usage), but there are a few dict-heavy places yet.
Agreed that Bazaar and Mercurial would be interesting use cases, especially for projects with large revision history graphs.
Memory usage analysis has come up recently on the bzr list:
https://lists.ubuntu.com/archives/bazaar/2010q3/069549.html
Python Natural Language Toolkit
https://www.nltk.org/
Give a huge corpus (Wikipedia?) and do any operation on it -- nltk will take huge loads of memory in all kinds of custom objects, lists and tuples.
From what I understand, PyExcelerator, a writer/reader for Excel files, takes huge amounts of memory for very large files. It uses pure Python objects for each cell, which kills memory use when you're writing many millions of cells.
A couple of possibilities from my own OSS code:
https://stromberg.dnsalias.org/~strombrg/treap
https://stromberg.dnsalias.org/~strombrg/pyindex.html
I'd most likely be happy to relicense the treap code as needed to facilitate inclusion. The pyindex code is under a UCI (I believe it's BSDish) license, and would probably need to remain so.
I really didn't think about it much, I'm just trying to chew through my RSS backlog, and ran into a post about pkgcore dealing with memory issues just a few minutes after I read this call for benchmarks.
Maybe you could use that.
You might want to lok at MiniLight:
https://www.hxa.name/minilight/#comparison
I'm the author of a scientific application that can be suited to your needs. It runs both with Python 2.x and PyPy, so I bundled a distribution with some example benchmarks if this interests you: https://dl.dropbox.com/u/7931953/pypy-bench.tar.bz2 (see bench.README)
An interesting observation in my opinion is that on small runs, CPython outperforms PyPy but this progressively reverses on longer runs.
@all: thanks for the proposals, I am looking at them.
@Franck: This is probably due to the JIT, which needs some time to compile at the beginning. Later, the assembler exists and executes quickly. Will look at your code, thanks for providing it.
Hello, i am the author of an chess program being written entirely in python. I haven't published it jet, because i am a bit ashame of its poor quality. However it should suffice for the sole purpose of benchmarking. Please drop me a note if you are interested. My email adress is: larudwer at freenet dot de
Some Notes:
The Program is just console mode (UCI), no gui.
it eats up all the memory you have
cpython is almost twice as fast as pypy-1.3 on this program and psyco accelerates it by another factor of two.
You could consider Tahoe-LAFS. A good reason to use it is that it is a practicality-oriented, widely deployed tool with significant memory usage that we routinely spend engineering effort to track and manage.
Here are some graphs of the memory usage of different versions of Tahoe-LAFS over time:
32-bit machine:
https://tahoe-lafs.org/tahoe-figleaf-graph/hanford.allmydata.com-tahoe_memstats.html
64-bit machine:
https://tahoe-lafs.org/tahoe-figleaf-graph/hanford.allmydata.com-tahoe_memstats_64.html
Here are some open tickets about memory usage in our issue tracker:
https://tahoe-lafs.org/trac/tahoe-lafs/query?status=!closed&keywords=~memory&order=priority
The reason not to use Tahoe-LAFS as a subject is that it uses several native-code libraries to for the CPU-intensive inner loops (cryptography, erasure coding). I really want those libraries, and hence Tahoe-LAFS, to be usable with cpyext as soon as possible, but I haven't tried and I assume that cpyext isn't 100% there yet.
By the way the easiest way to measure the performance of Tahoe-LAFS would be to run its unit tests and measure the memory usage and runtime. This is not only the easiest way, but it is also a pressing issue for us! Tahoe-LAFS unit tests take too long to run, and this causes problems for us, and we very much like it if they could run to completion faster.
https://tahoe-lafs.org/trac/tahoe-lafs/ticket/20# unit tests take too long
Here are our buildbots showing unit test runtime among other things:
https://tahoe-lafs.org/buildbot/waterfall?show_events=true&builder=Kyle+OpenBSD-4.6+amd64&builder=hardy-amd64&builder=Arthur+lenny+c7+32bit&builder=Eugen+lenny-amd64&builder=David+A.+OpenSolaris+i386&builder=Ruben+Fedora&builder=Zooko+zomp+Mac-amd64+10.6+py2.6&builder=FreeStorm+WinXP-x86+py2.6&builder=tarballs
rawdog (disclosure of bias: I wrote it) sounds like it might be of use. It's an RSS aggregator that generates static HTML. Pure Python 2, with lots of string processing, mostly in the feedparser module. Memory usage and runtime depends on how many feeds it's reading and how much history it keeps, since it does everything in memory at the moment, using pickle for persistant state. (With my 800-odd feeds and two-month history, writing the entire store to HTML will use a few hundred meg of memory and run for several minutes.)
A future redesign will use a more sensible database-backed approach...
Scapy would be a great one to benchmark. Depending on the size of the packet capture, it can consume quite a bit of proc/mem when loading and dissecting large captures. I run it at work on Cpython and would love to see it running/optimized under pypy. The only problem is that I believe it uses some 2.6 pythonisms.
Thanks again for all the additional pointers. Still investigating all of them.
How about Nucular, a search engine written in python by aaron watters.
https://nucular.sourceforge.net/
In my view, the natural competitors to PyPy (in the domain of fast interpreters for dynamic languages) are Tracemonkey and V8. Therefore, translations of the Sunspider, V8, and Dromaeo benchmarks would be appropriate.
PyOhio
This weekend I delivered a talk at PyOhio (an annual conference in Columbus, OH, USA) on PyPy and Unladen Swallow. The talk covered reasons that Python, the language, is hard to optimize, why CPython is slow, and a few optimizations that PyPy and Unladen Swallow have implemented. The slides from my talk are online, and the talk was recorded so a video will follow. I gave a similar talk to ChiPy (the Chicago Python user group), which was also recorded and the video is available. Both audiences were excited about the futures for PyPy and Unladen Swallow, and for the future of a faster Python.
Alex
I do not understand why is python so hard to optimize- after all, LuaJIT is VERY fast, and I thought Lua has the same dynamical features as python. I'm no Python nor Lua expert, but it would be nice knowing...
Thanks!
Any chance of putting the slides somewhere that can be directed downloaded?
There's a link to download the slides on the right hand side. This link: https://www.scribd.com/document_downloads/direct/35240506?extension=pdf&ft=1281033139<=1281036749&uahk=mAWsHOEi/etYRUUXWst+oYKiWIU
should also work.
I've seen the video, and the question I asked is not answered: what dynamic feature Python has that Lua doesn't?
is such a specific feature responsible for the fast LuaJIT?
Thanks.
The main meta-reason is that Python is a very complex language compared to lua, so you have to take into account a lot of things that you don't care about in lua. one example is new style classes with insane semantics about descriptors.
The author of Luajit, Mike Pall, participated in a long thread posted here https://lambda-the-ultimate.org/node/3851#comment-57700 , as well as Maciej and others.
There, he said about python:
"Python (the core language) just has different quirks that need to be worked around. But no show stoppers.
What is more challenging, is to efficiently handle Python (the programming environment) with all of its classes and methods. In particular the plethora of container types, since you really want to inline their accessors.
Since I don't believe in multi-language VMs, LuaJIT is pretty Lua-specific on all levels. Your best bet right now is to join the PyPy effort (they already handle the issues I mentioned)."
Using virtualenv with PyPy
Thanks to the work that was recently done on the sys-prefix branch, it is now possible to use virtualenv with PyPy.
To try it, you need:
- a recent version of PyPy: PyPy 1.3 does not contain the necessary logic to work with virtualenv, so you need a more recent PyPy from subversion trunk. You can either build it by yourself or download one of our precompiled nightly builds
- a copy of virtualenv-pypy: this is a fork of virtualenv that contains all the patches needed to work with PyPy, and hopefully will be merged back at some point. It should be totally compatible with the official version of virtualenv, so it is safe to use it even to create non-PyPy environments. If you notice some weird behavior that does not happen with the standard virtualenv, please let us know.
The directory layout has been redesigned in a way that it is possible to use virtualenv to install a PyPy both from a precompiled tarball or from an svn checkout:
# from a tarball
$ virtualenv -p /opt/pypy-c-jit-76426-linux/bin/pypy my-pypy-env

# from the svn checkout
$ virtualenv -p /path/to/pypy-trunk/pypy/translator/goal/pypy-c my-pypy-env
Once the environment has been created, you can enter it as usual. Note that bin/python is now a symlink to bin/pypy.
Enjoy it :-)
I recently made a script called pypyenv for easily installing PyPy in a virtualenv side by side with CPython, sharing site-packages. It will allow one to experiment with PyPy in a working virtualenv without breaking current code.
@Alex: nice. pypyenv is obviously something different that virtualenv-pypy, but it might be useful if someone wants to try PyPy.
However, I don't think that sharing site-packages is a good idea: it works as long as you have only pure python packages, but it stops as soon as you build some C extension, as the .so produced by PyPy are incompatible with CPython
@Antonio
Interesting point, I'll mention it in the README. (by the way, thank you for your work, PyPy rocks my socks!)
A bit unrelated, but would it be possible to have nightly releases with consistent filenames? Right now, they all include the svn revision number (I assume that's what it is), which makes it difficult to write a script that downloads and installs the latest version.
Specifically, I'm looking to create an Arch pkgbuild, because it takes too damn long to compile on my notebook, and I don't want to use the stable release.
it seems there's no pypy/translator/goal/pypy-c anymore?
how to init virtualenv from pypy source now?
Is the information here still valid? Or should virtualenv work fine with pypy?
Am I sensing a PyPy 1.4 release?
@intgr: "yes", although we don't have any concrete plan to do a release. But it's true that if we keep all our tests green, doing a release it's much less effort