Some Ways that PyPy uses Graphviz
Some way that PyPy uses Graphviz
Somebody wrote this super cool thread on Twitter about using Graphviz to make software visualize its internal state:
🧵 Make yours and everybody else's lives slightly less terrible by having all your programs print out their internal stuff as pictures; ✨ a thread ✨ pic.twitter.com/NjQ42bXN2E
— Kate (@thingskatedid) April 24, 2021
PyPy is using this approach a lot too and I collected a few screenshots of that technique on Twitter and I thought it would make a nice blog post too!
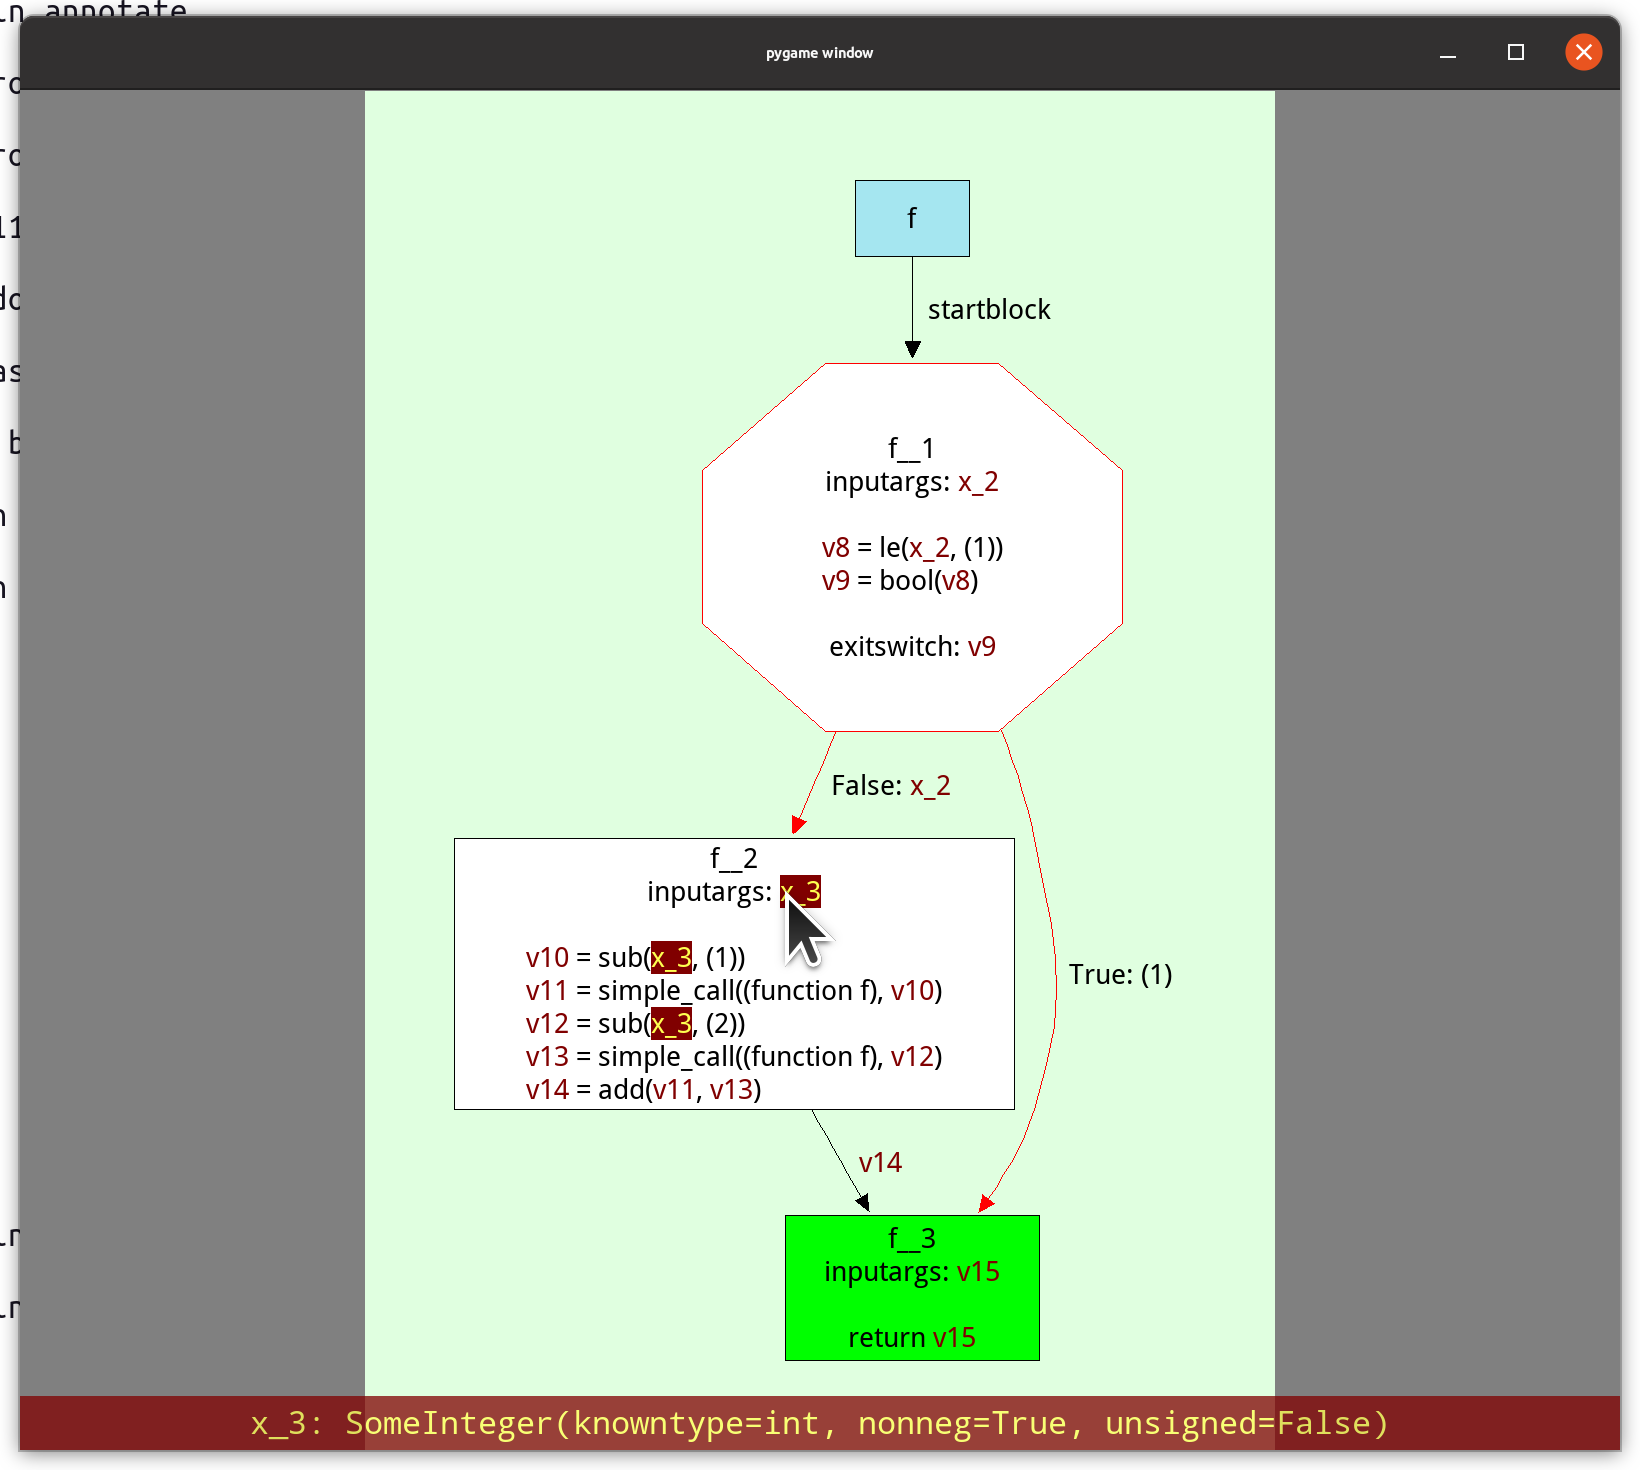
The most important view early in the project, and the way that our Graphviz visualizations got started was that we implemented a way to look at the control flow graphs of our RPython functions after type inference. They are in static single information form (SSI), a variant of SSA form. Hovering over the variables shows the inferred types in the footer:
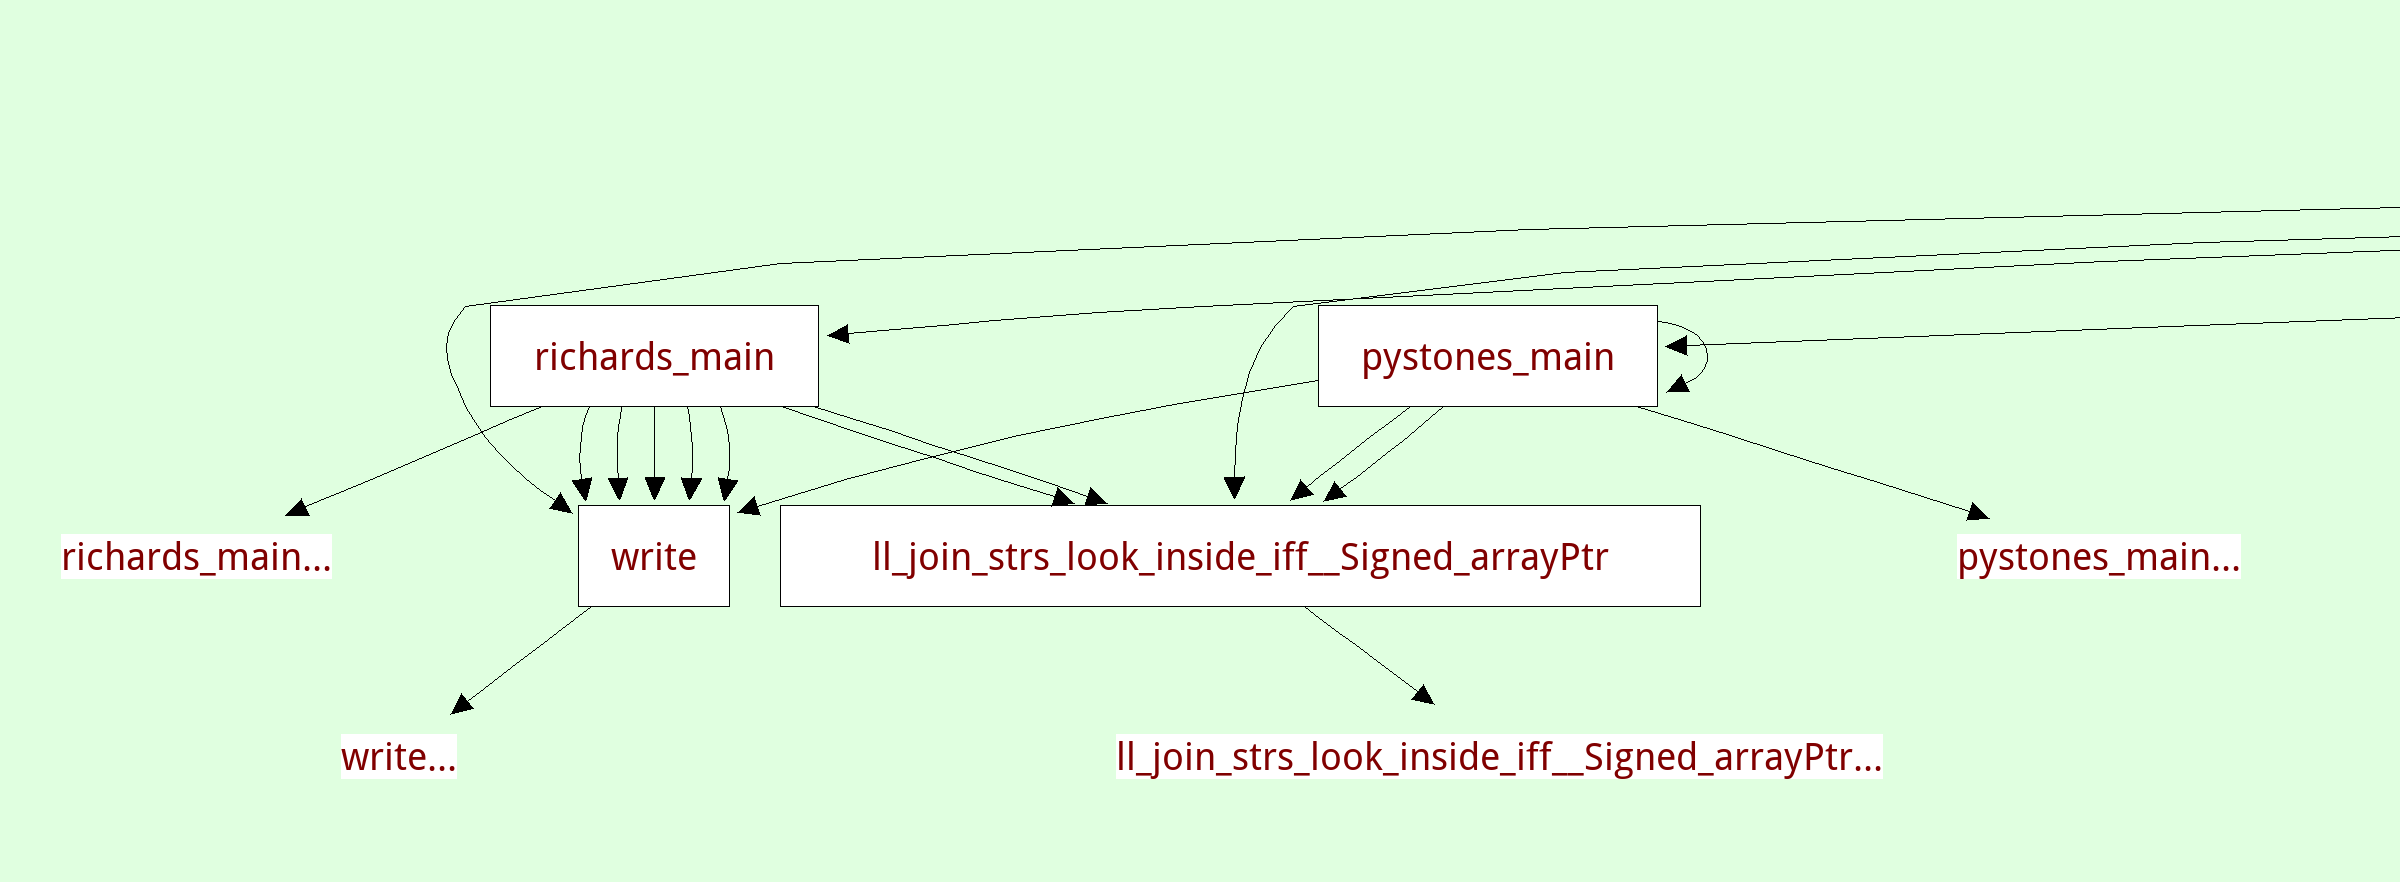
There's another view that shows the inferred call graph of the program:
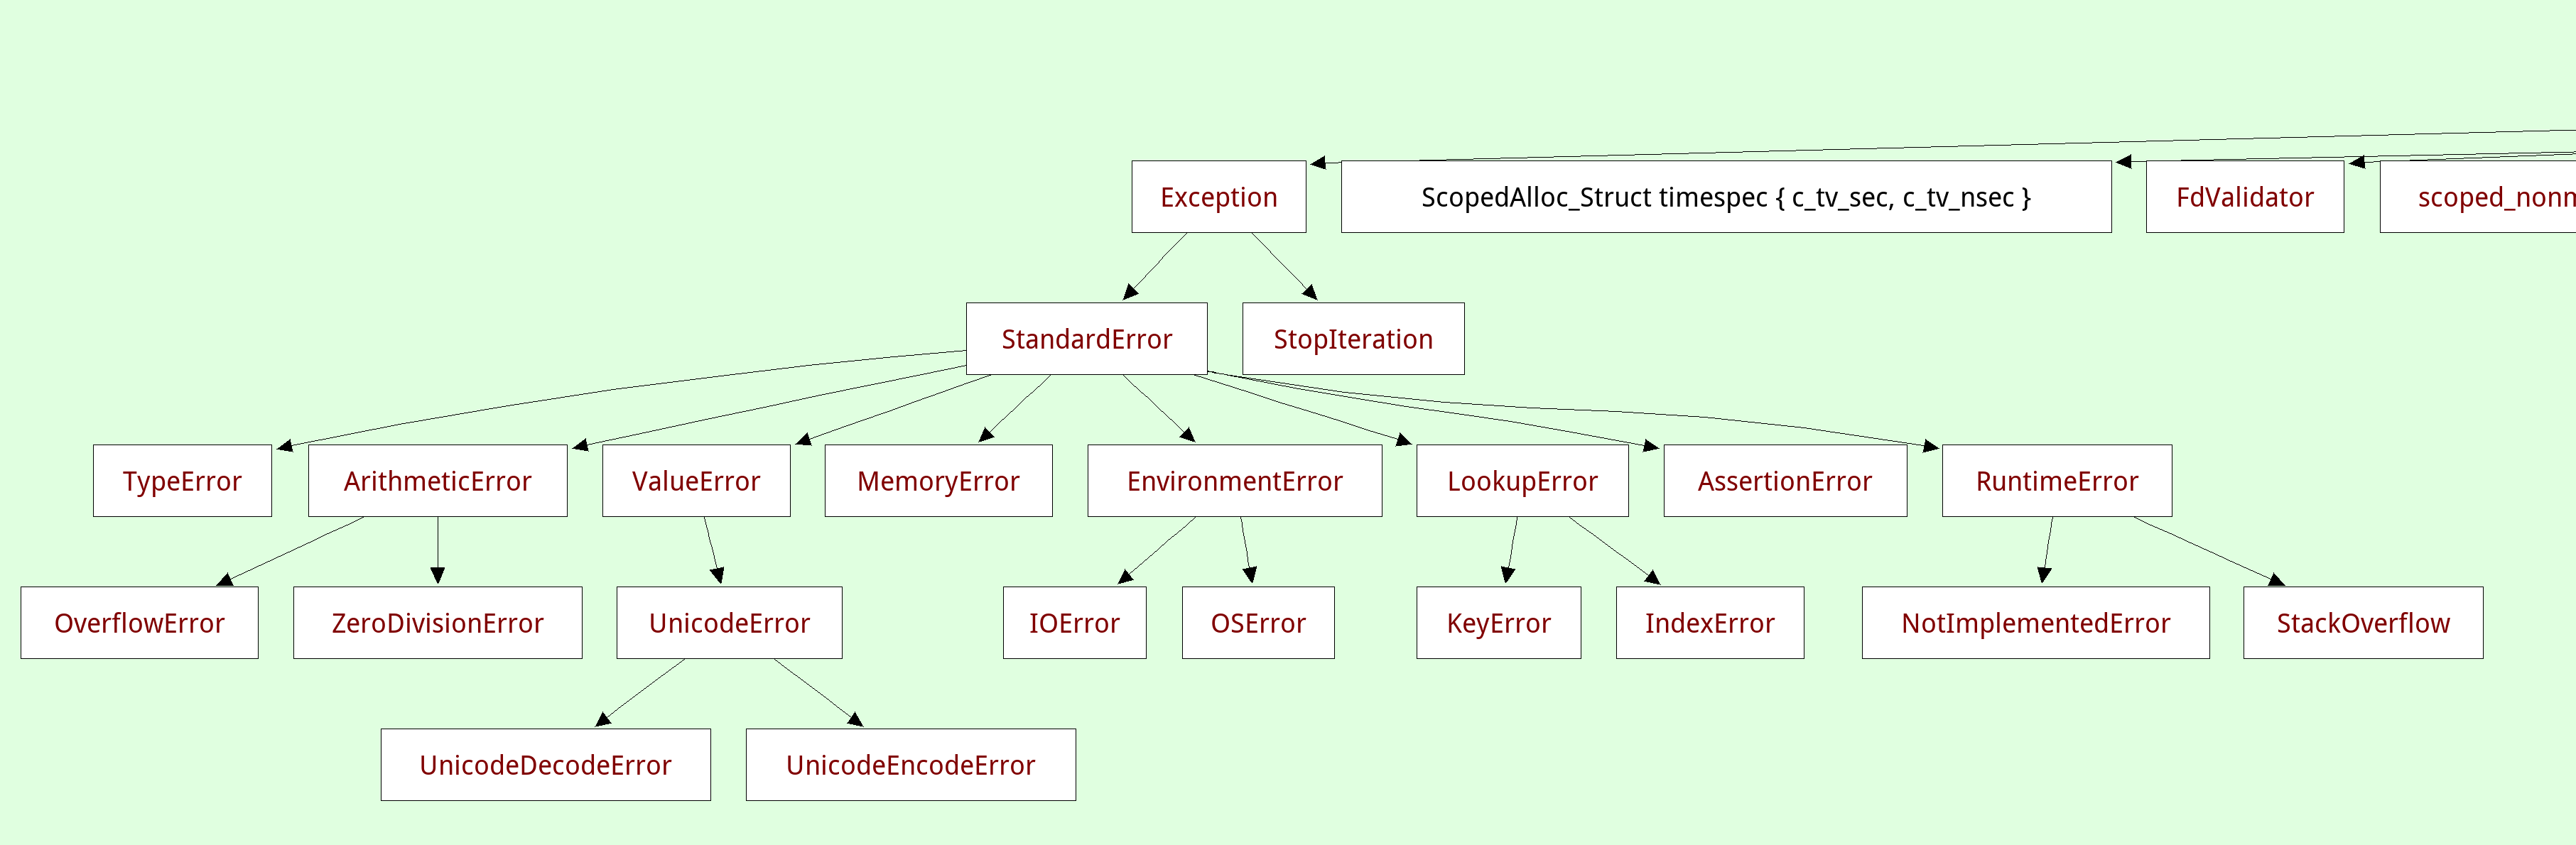
A related viewer shows the inferred class hierarchy (in this case the exception hierarchy) and you can focus on a single class, which will show you its base classes and all the methods and instance attributes that were found:
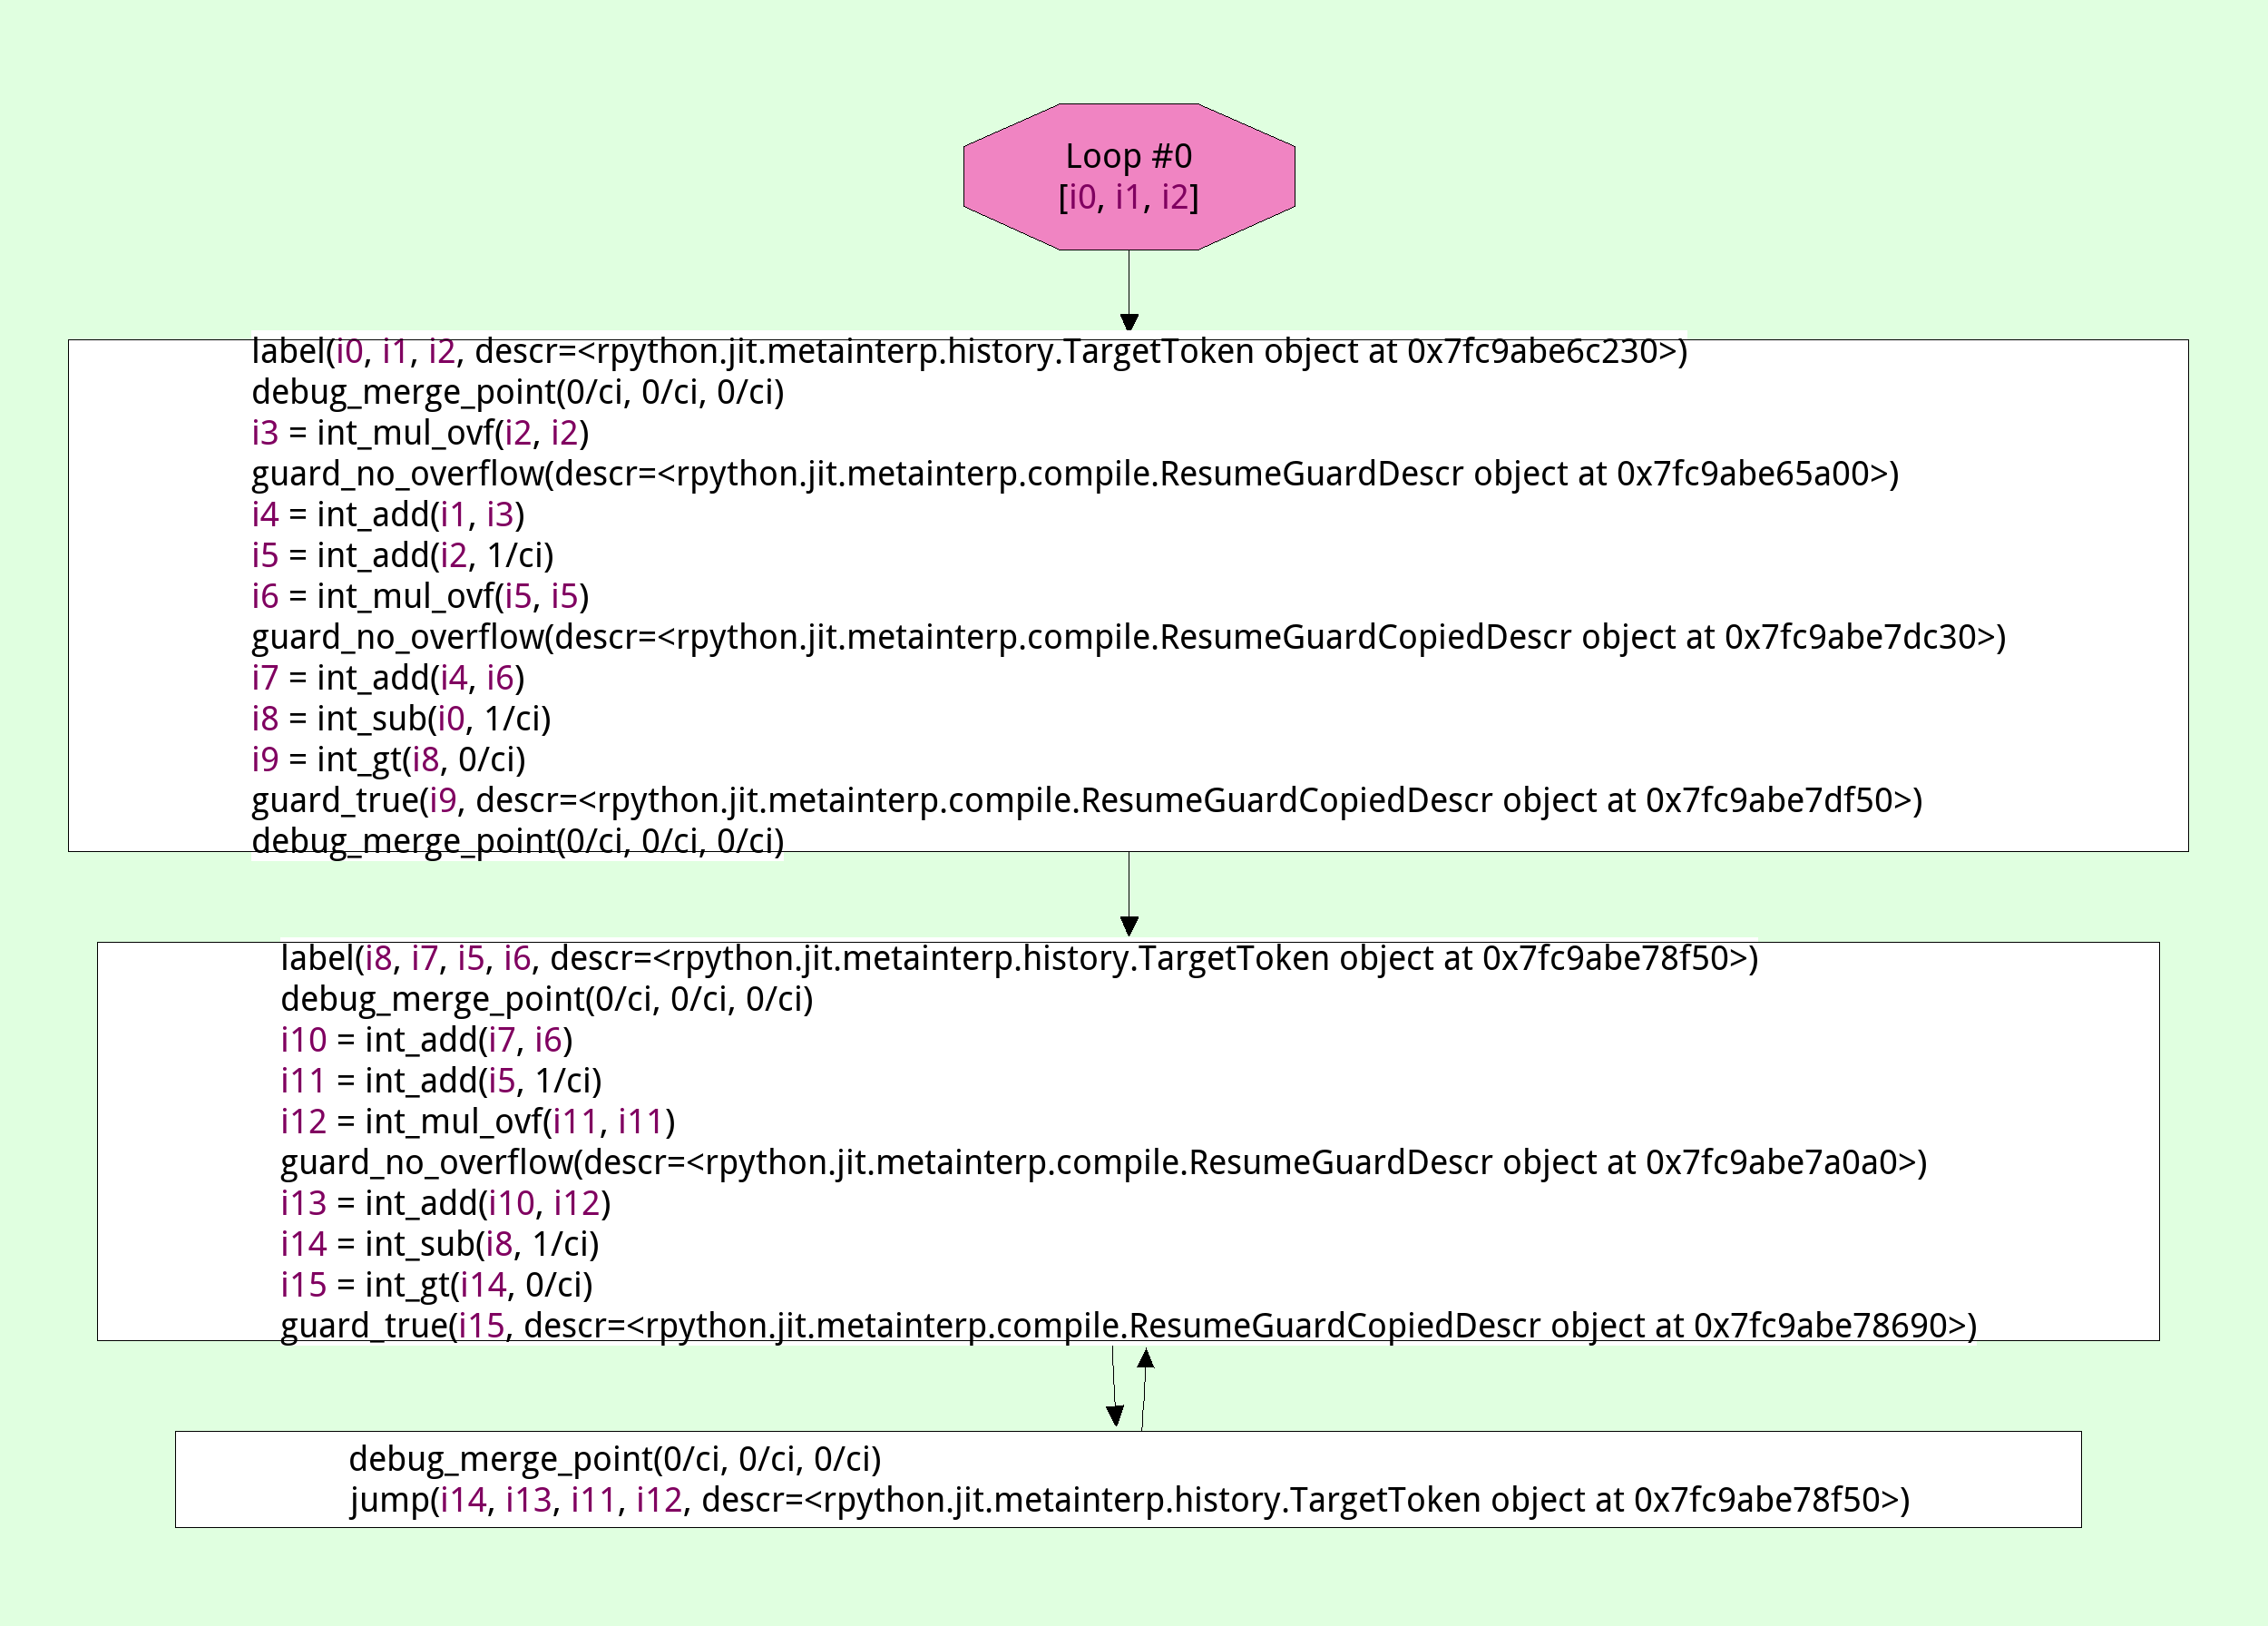
We also have a view to show us the traces that are produced by the tracing JIT tests. this viewer doesn't really scale to the big traces that the full Python interpreter produces, but it's really useful during testing:
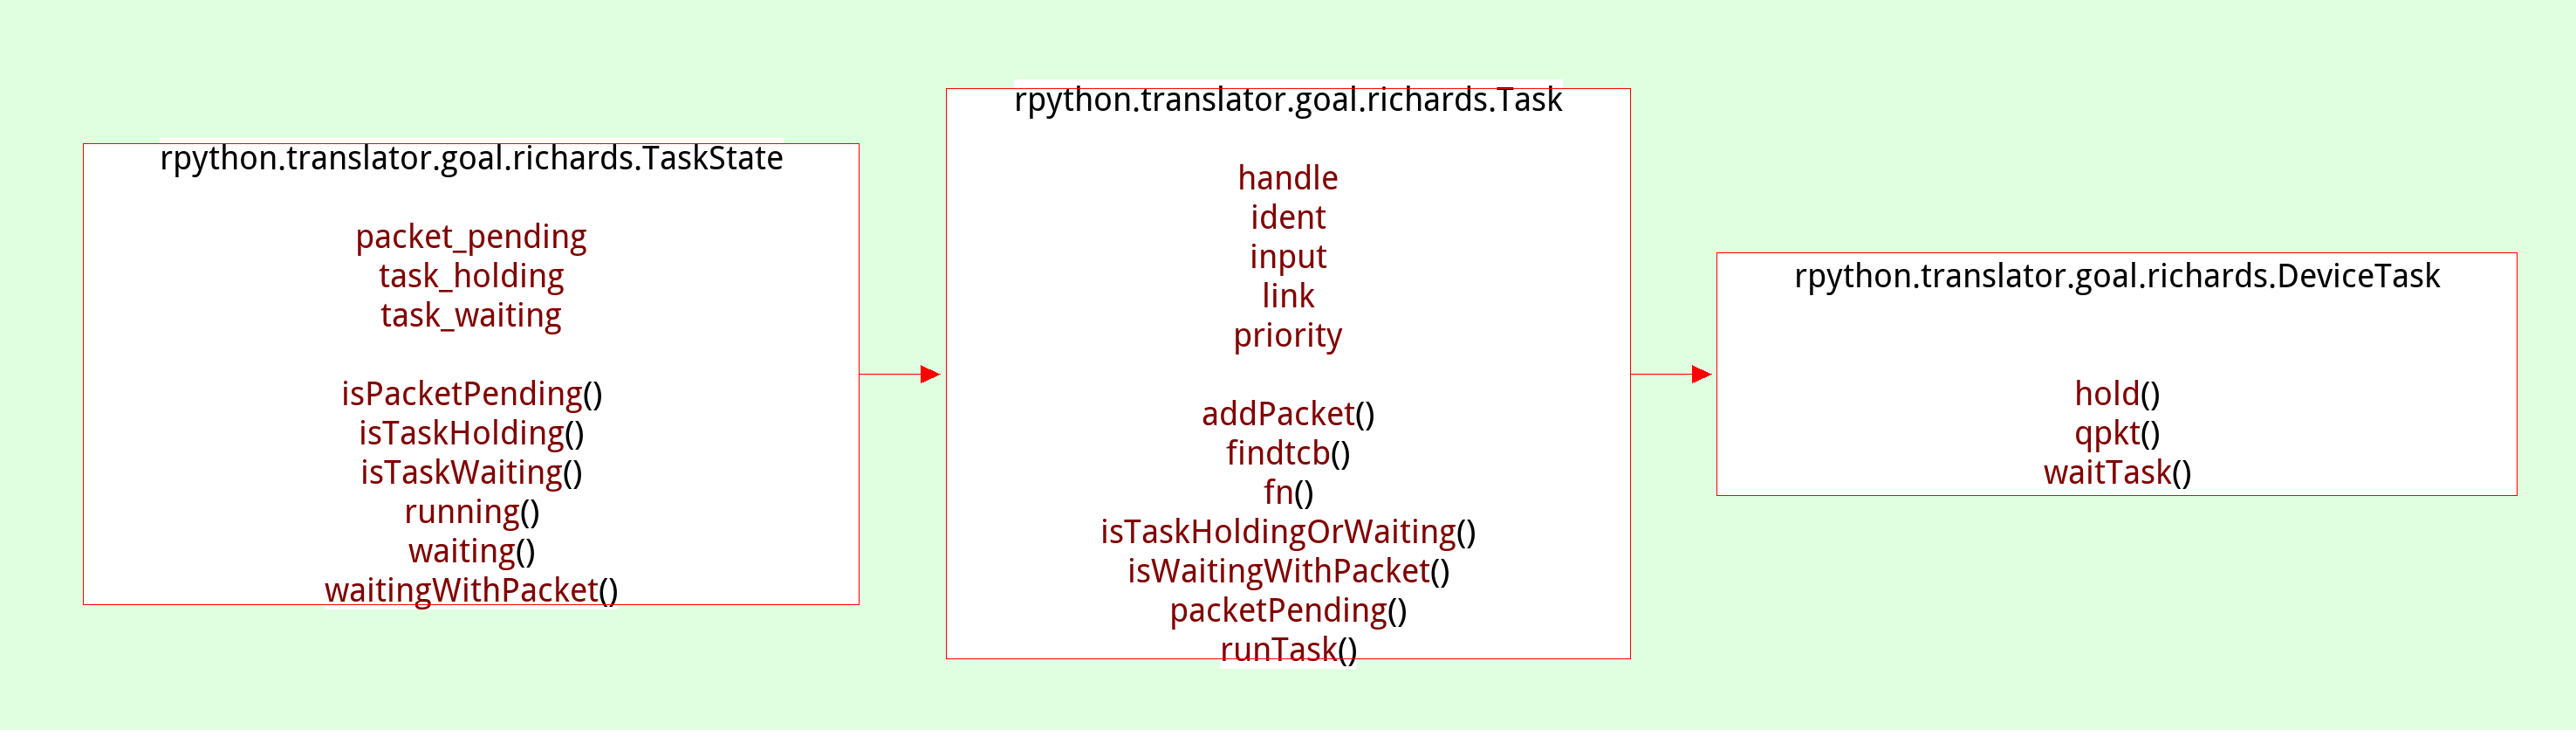
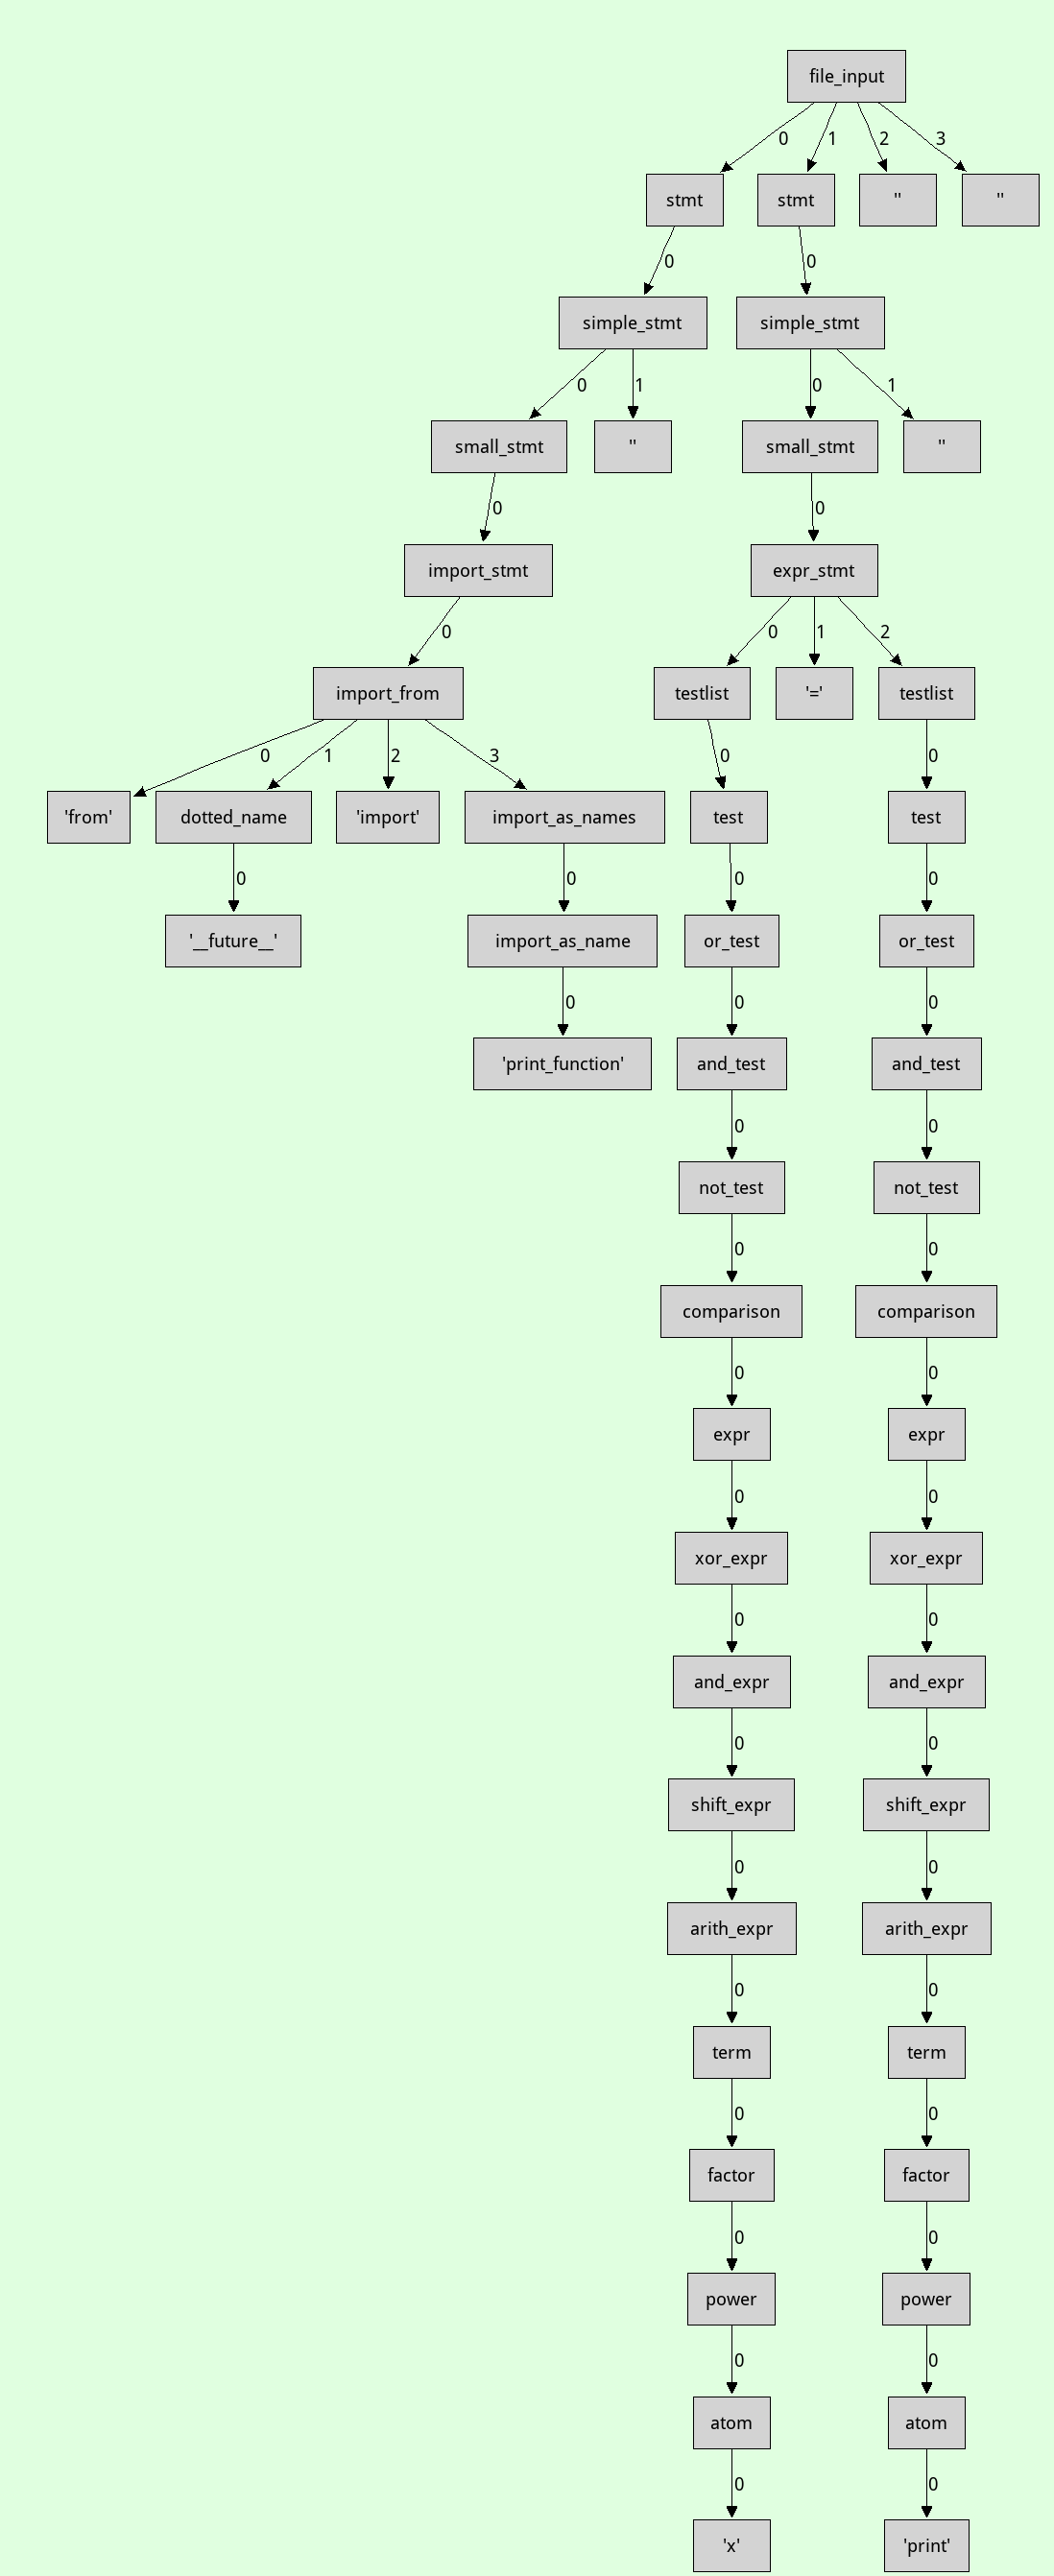
Then there are more traditional tree views, eg here is a parse tree for a small piece of Python source code:
Parsing-related we have visualized the DFAs of the parser in the past, though the code is unfortunately lost.
All these visualizations are made by walking the relevant data structures and producing a Graphviz input file using a bit of string manipulation, which is quite easy to do. Knowing a bit of Graphviz is a really useful skill, it's super easy to make throwaway visualizations.
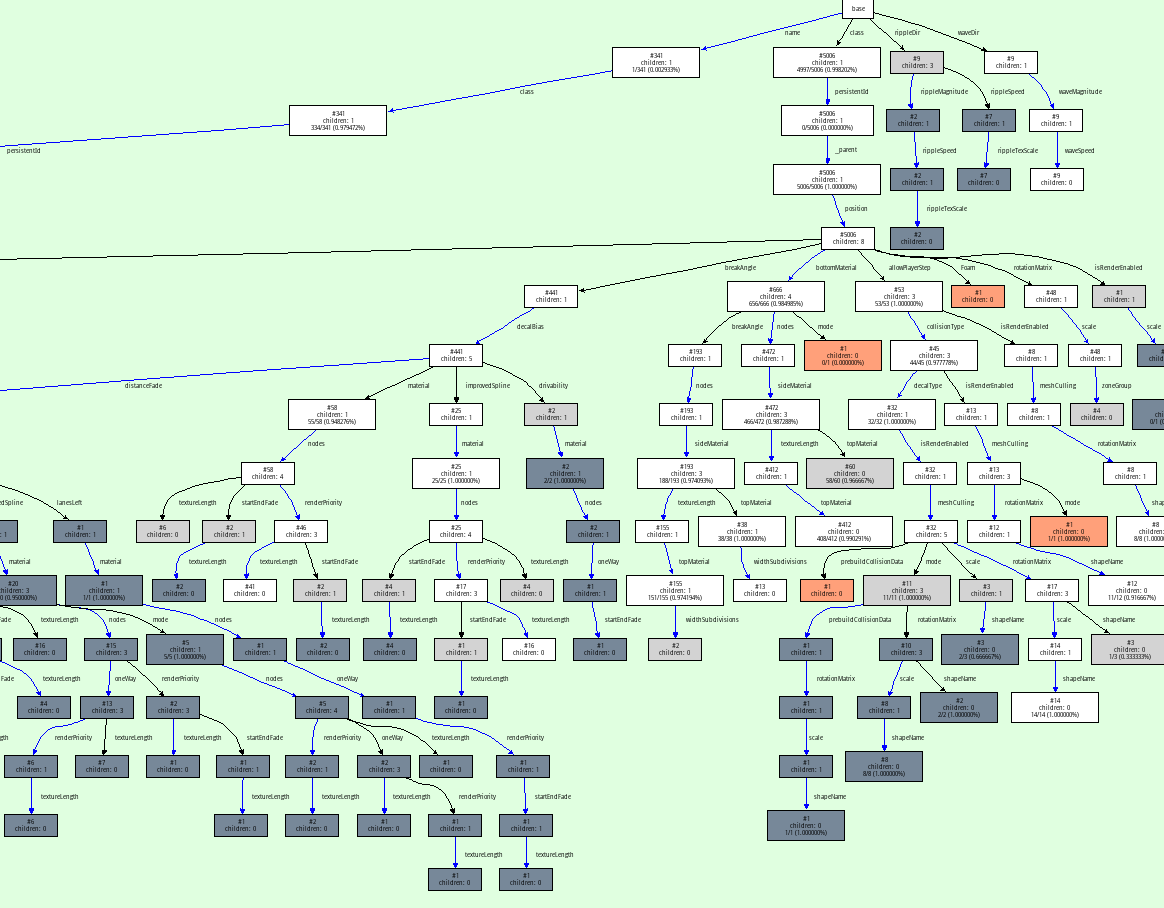
For example here is a one-off thing I did when debugging our JSON parser to show the properties of the objects used in a huge example json file:
On top of graphviz, we have a custom tool called the dotviewer, which is written in Python and uses Pygame to give you a zoomable, pannable, searchable way to look at huge Graphviz graphs. All the images in this post are screenshots of that tool. In its simplest form it takes any .dot files as input.
Here's a small video dotviewer, moving around and searching in the json graph. By writing a bit of extra Python code the dotviewer can also be extended to add hyperlinks in the graphs to navigate to different views (for example, we did that for the callgraphs above).
All in all this is a really powerful approach to understand the behaviour of some of code, or when debugging complicated problems and we have gotten a huge amount of mileage out of this over the years. It can be seen as an instance of moldable development ("a way of programming through which you construct custom tools for each problem"). And it's really easy to get into! The Graphviz language is quite a simple text-based language that can be applied to a huge amount of different visualization situations.
Comments